Enhancing Workplace Efficiency with Productivity Analysis Software
Boost performance and streamline operations with advanced productivity analysis software. Optimize workplace efficiency through real-time tracking and insightful analytics.
Detailed Dashboard
Associate Rank
Productivity Analysis
Work Activity Log
Free Trial
No Credit Card Required
Exclusive Support
Employee productivity analysis software is a tool that measures how employees spend their work time — tracking active hours, app usage, and output — and generates reports that help managers identify performance trends, coach underperformers, and optimise team efficiency.
What is Trackpilots Employee Productivity Analysis?
Trackpilots is a comprehensive employee productivity software offering a Detailed Dashboard, Associate Rank, Productivity Analysis, and Work Activity Log to enhance efficiency, ensure accountability, and optimize workflows.
Free 30 days trial
Exclusive Support
No Fees
All-in-One Employee Productivity Suite
Real-time productivity scoring per employee and team
Detailed dashboard with active hours and app usage breakdowns
Associate rank — compare employee performance side by side
Work activity log with timestamped session records
Weekly and monthly trend reports generated automatically
Configurable productive app classifications per role
No Credit Card Required
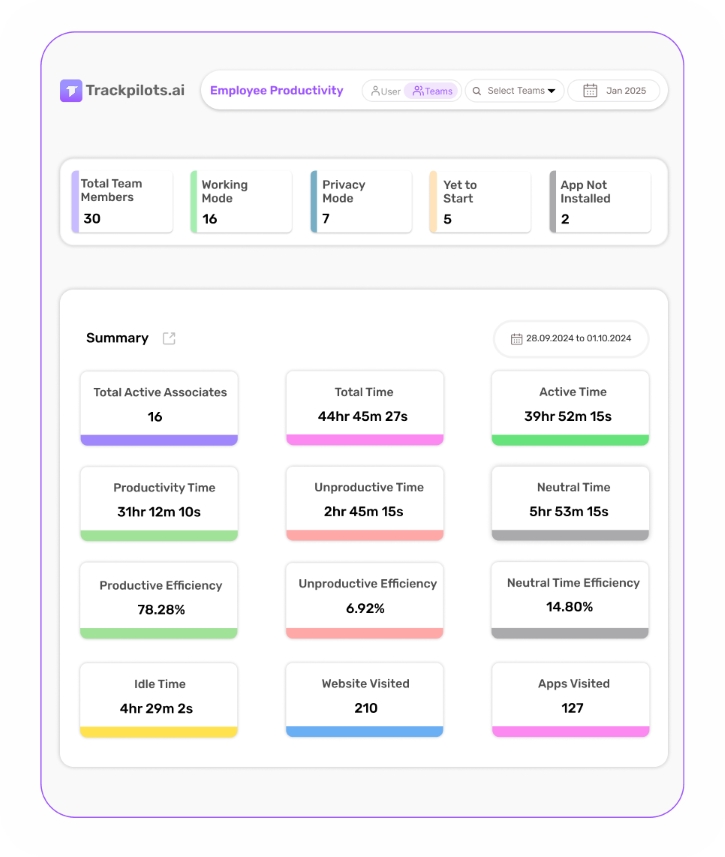
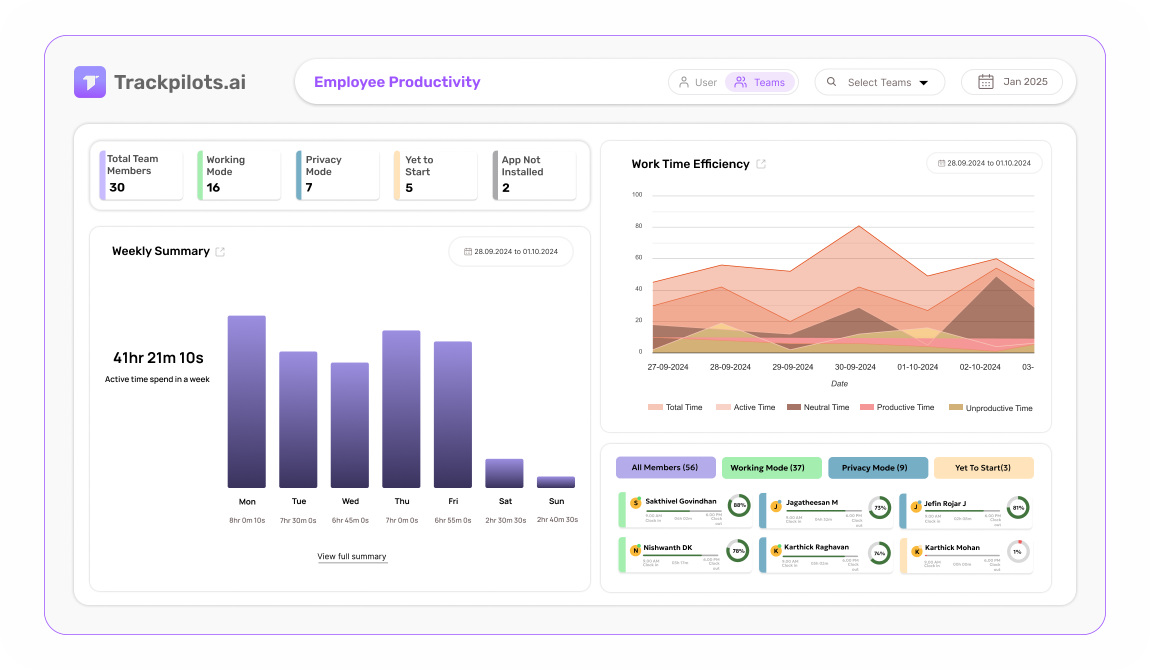
Detailed Dashboard
Get a comprehensive view of employee work activity in real time.
Associate Rank
Evaluate and rank employees based on key performance metrics.
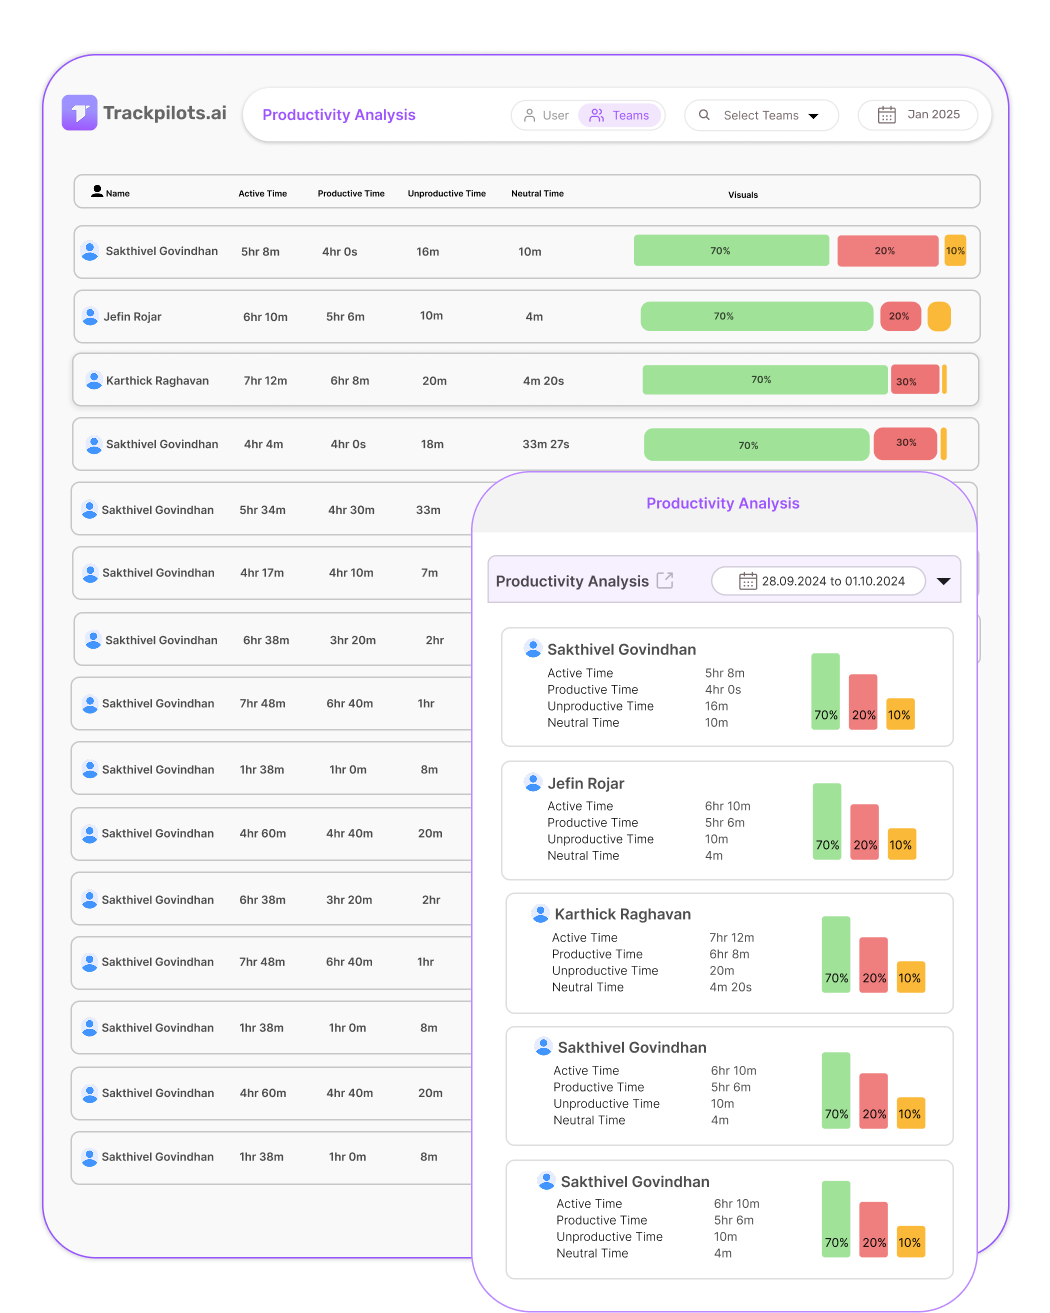
Productivity Analysis
Measure and analyze employee productivity in real time.
Work Activity Log
Monitor and log all essential work activities seamlessly.
How Trackpilots Employee Productivity Analysis Software Works
Trackpilots employee productivity analysis software captures, measures, and visualises workforce performance in real time — from individual contributors to department-level trends. Here is the step-by-step process behind every insight.
1. Agent Installs on Every Device
The Trackpilots desktop agent is deployed on each employee's Windows, macOS, or Linux device. Once installed, it begins tracking automatically — no manual clock-ins required. The agent records active application usage, website visits, and keyboard and mouse activity as a productivity score. All data collection runs silently in the background so employees are never interrupted, and the lightweight process uses minimal system resources.
2. Apps and Sites Are Classified
Every application and website is automatically classified as Productive, Unproductive, or Neutral based on the employee's role and department. A developer visiting GitHub is productive; the same visit is unproductive for a sales agent. Managers can customise classifications at the team or individual level, so the staff productivity analysis reflects real-world work patterns — not generic defaults. This classification layer is what separates meaningful insight from raw data.
3. Productivity Scores Are Calculated
Trackpilots calculates a real-time productivity score for each employee based on the ratio of productive to total active time. Scores update throughout the day and are visible in the live dashboard. Managers can filter by individual, team, or department to compare performance side by side. The system also flags idle periods and unproductive streaks with configurable alerts, so issues are caught early — not in the next quarterly review.
4. Trend Reports Are Generated
At the end of each shift, day, week, or month, Trackpilots automatically generates productivity reports. Productivity monitoring with trend analysis lets managers compare performance over time — spotting whether scores are improving, declining, or holding steady after a process change. Reports include heatmaps showing peak focus hours, department-level breakdowns, and associate rank tables that list top performers and those who need coaching. All reports are exportable for payroll, HR review, or client billing.
From first login to actionable insight, Trackpilots employee productivity analysis software gives managers a complete picture of workforce performance — without manual data entry or end-of-day guesswork.
Start Free Productivity AnalysisBook a Demo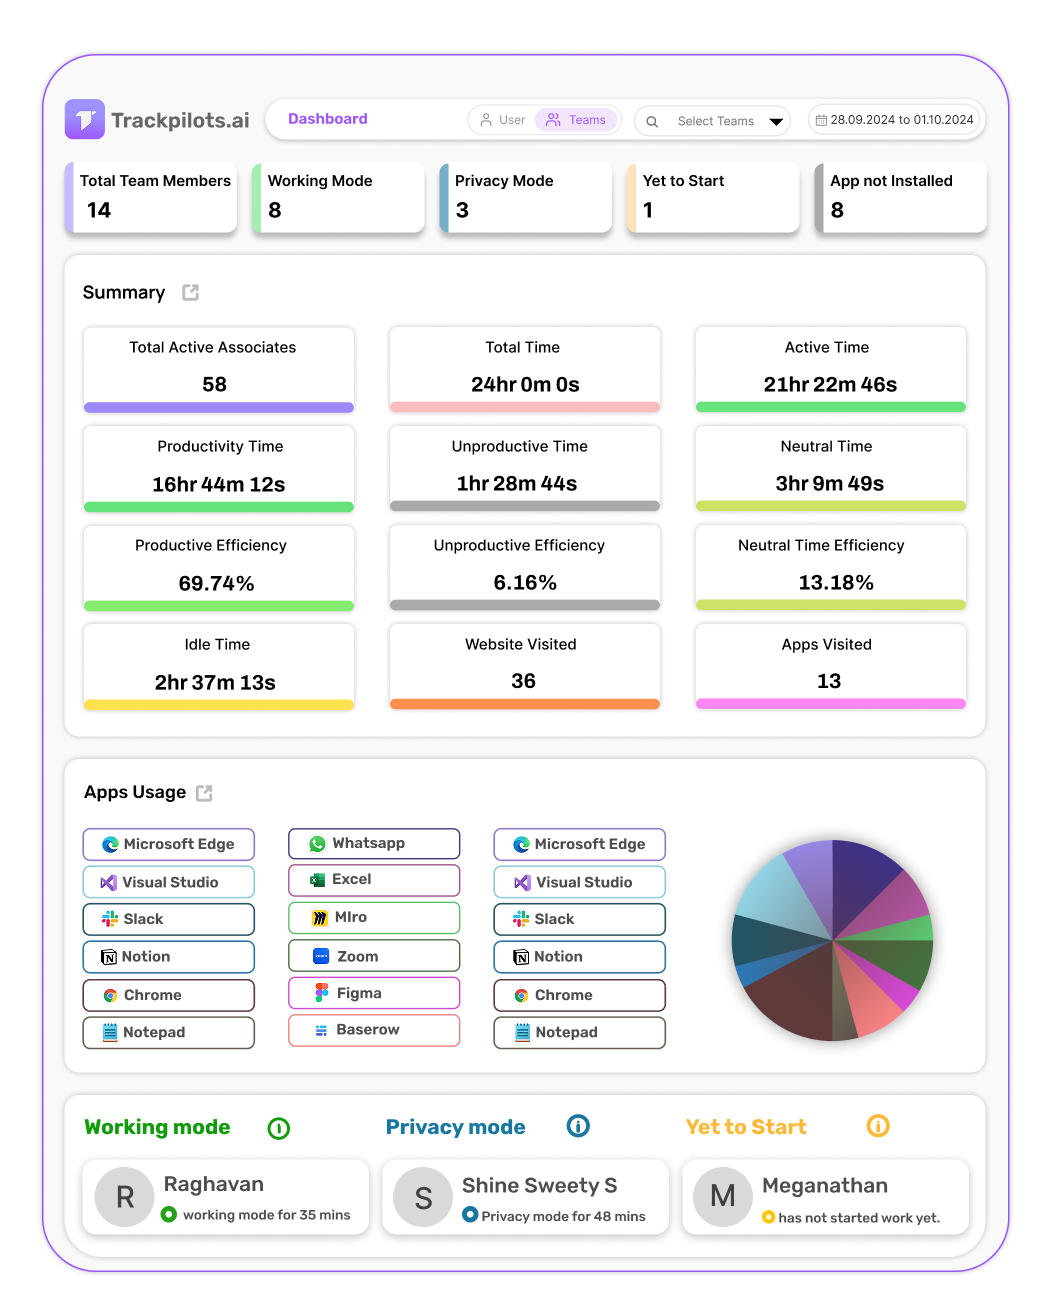
Gain real-time insights into employee work patterns
Detailed Dashboard provides a comprehensive overview of employee activities.
It helps managers track work trends and optimize productivity.
Users can analyze performance metrics and improve task efficiency.
This feature ensures better decision-making and workflow management.
Evaluate and rank employees based on performance metrics
Associate Rank provides a structured ranking system for employees.
It helps managers assess performance levels and recognize top contributors.
Users can track progress and set benchmarks for improvement.
This feature enhances motivation, accountability, and workforce efficiency.
Optimize performance with real-time productivity insights
Productivity Analysis tracks efficiency levels across various tasks.
It provides data-driven insights to improve workforce output.
Managers can identify performance trends and boost engagement.
This feature helps businesses maximize overall productivity.
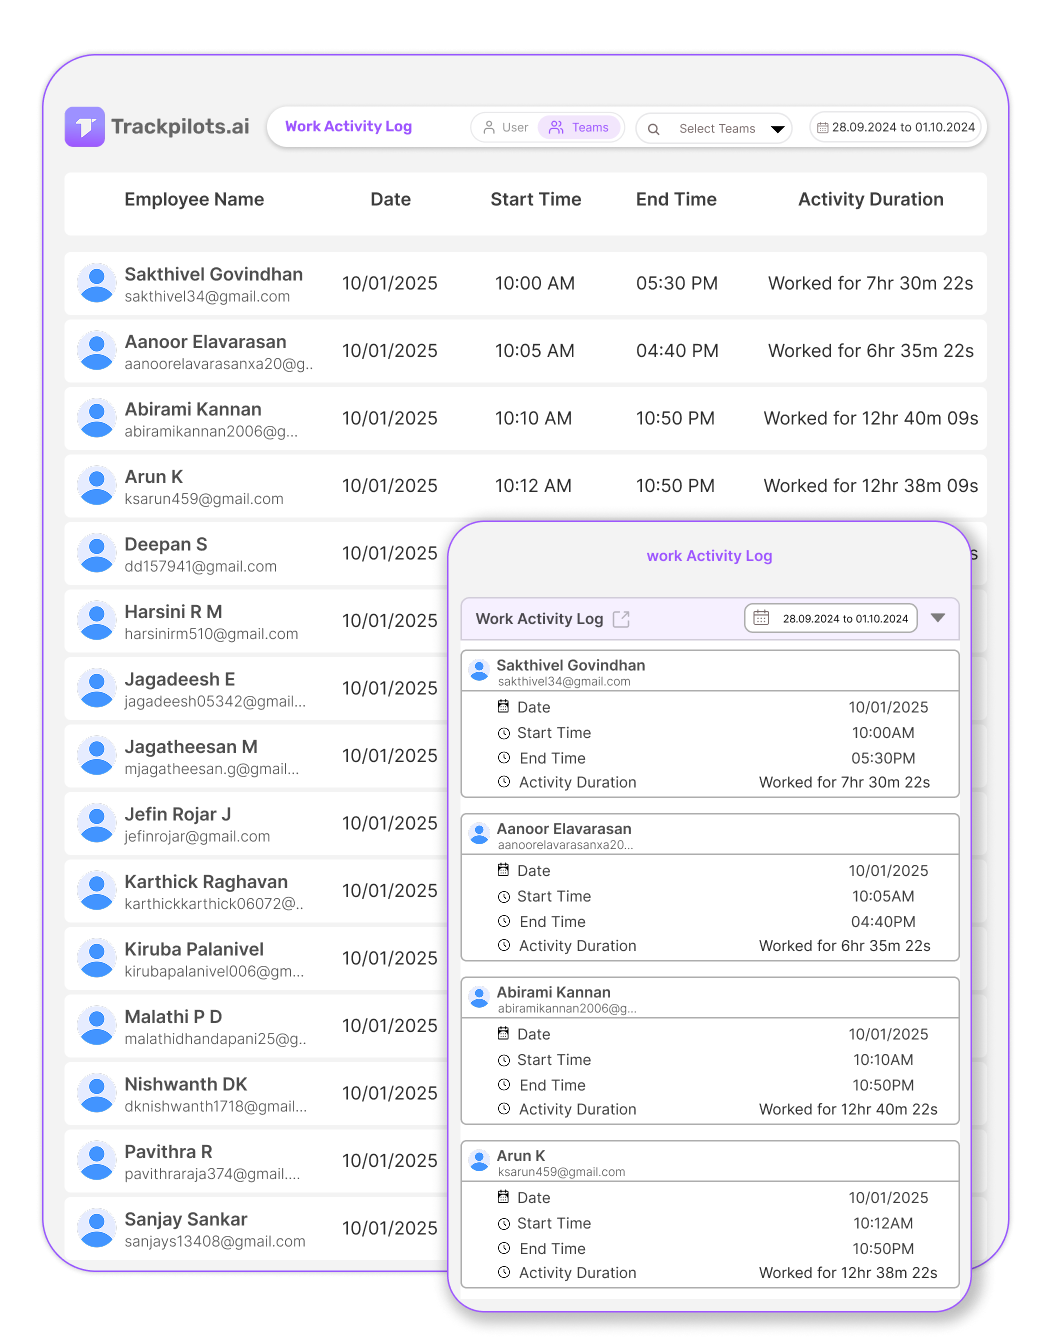
Monitor and log employee activities seamlessly
Work Activity Log records all key work-related activities.
It provides a clear breakdown of employee engagement levels.
Managers can track productivity trends and optimize workflows.
This feature enhances efficiency while maintaining transparency.
How a 50-Person Remote Team Uses Trackpilots for Department-Level Productivity Analysis
A growing SaaS company with 50 remote employees across engineering, sales, and customer support was struggling to identify where productivity was lost — and which departments were overloaded versus underperforming.
The Challenge
The HR manager had no reliable way to compare productivity across departments. Weekly standups gave anecdotal reports. Timesheets were filled out at the end of the week and often inaccurate. The company had no visibility into whether employees were spending time on deep work or switching between unproductive sites throughout the day.
The engineering team was consistently missing sprint deadlines, but management did not know whether the issue was workload, distraction, or unclear task ownership. The sales team's productivity scores were unknown, and customer support response times were lagging with no clear data on why.
The company needed a staff productivity analysis tool that could show department-level data without requiring employees to self-report their time.
How They Used Trackpilots
The company deployed Trackpilots employee productivity analysis software across all 50 laptops in a single afternoon. Within 24 hours, the dashboard populated with real productivity data — no training required for employees.
Engineering department: Managers filtered the productivity dashboard by the engineering team and discovered that developers were highly productive from 9 AM to 12 PM but dropped sharply after lunch. Peak focus hours were rescheduled — deep work blocks were protected and meetings were moved to afternoons.
Sales department: Productivity monitoring with trend analysis showed that three out of twelve sales reps had a productive app usage rate below 40%. After reviewing their app logs, it was clear they were spending significant time on non-CRM tools. Targeted coaching improved their scores by 28% in three weeks.
Customer support: The associate rank feature identified the top five support agents and the bottom three. HR used the data to pair high performers with struggling agents for peer coaching — without guesswork or manager bias.
Results After 60 Days
+34%
Average productivity score across all 50 employees, up from 58% to 78%.
−22%
Reduction in idle time logged across engineering and support departments.
3 hrs/week
Saved by HR on manual report preparation — automated weekly reports replaced spreadsheets entirely.
The company now runs a monthly staff productivity analysis review using Trackpilots trend reports. Department heads receive automated weekly summaries, and the HR team uses associate rank data to inform promotion decisions — backed by six months of objective performance data, not subjective manager impressions.
How Trackpilots Calculates Your Productivity Score
The productivity score in Trackpilots is a 0–100 index calculated for each employee at the end of every working day. It is designed to reflect genuine output rather than time-at-desk, and it combines three weighted inputs: active time ratio, application category breakdown, and inactivity frequency.
Active vs Idle Time Ratio
Trackpilots distinguishes between active time (keyboard or mouse input detected, application in focus) and idle time (no input for more than the configured threshold, typically 5 minutes). The ratio of active minutes to total logged-in minutes forms the base of the score. An employee logged in for 8 hours with 7.2 hours of active time has a 90% activity ratio — the highest possible starting point for that day.
Application Categorisation
Not all active time is equal. Trackpilots applies a productive / unproductive / neutral classification to every application and website an employee uses, based on categories set by the admin. Time spent in productive apps (IDE, document tools, project management software, customer CRM) contributes positively to the score. Time in unproductive apps (social media, entertainment, gaming) reduces it. Admins can customise which apps belong to which category, making the score industry-specific — a social media app might be productive for a marketing team and unproductive for a development team.
Daily Score and 7-Day Rolling Average
The daily score is a weighted combination of activity ratio (60%) and productive app proportion (40%), producing a number between 0 and 100. A score above 80 is considered high-performing; 60–79 is standard; below 60 flags a day worth investigating. The 7-day rolling average smooths out anomalies — a single low day due to external meetings or a slow morning does not define an employee's productivity profile. The rolling average is what managers should use for performance conversations.
This approach makes Trackpilots genuine employee productivity monitoring software rather than a simple time-clock — the score reflects what employees were doing, not just whether they were logged in.
Productivity Trends: Weekly and Monthly Analysis
Daily scores are useful for spotting individual outliers. Weekly and monthly trends are where productivity tracking software delivers its highest management value — they reveal patterns that single-day snapshots cannot.
Spotting Burnout Before It Becomes a Problem
A common burnout pattern in Trackpilots data looks like this: an employee's daily score rises above 85 for two to three consecutive weeks — then drops sharply to 55–65 and stays there. The high-performance period represents overwork; the crash represents exhaustion and disengagement. Weekly trend charts make this pattern visible to managers three to four weeks before it typically surfaces as a resignation, a missed deadline, or a performance complaint. Catching it early means an intervention — a lighter workload, a check-in conversation, or a planned day off — rather than a crisis.
Identifying Disengagement Trends
Disengagement shows differently from burnout in the data. Rather than a post-peak crash, disengaged employees show a gradual, consistent decline in productive app usage over four to eight weeks — active hours remain stable, but the proportion of time in productive vs unproductive applications shifts. This is invisible in daily snapshots and requires monthly trend views to detect. Trackpilots' monthly productivity report surfaces this automatically for each employee, allowing managers to identify and address disengagement before it becomes exit behaviour.
Weekly trend reports in Trackpilots are generated automatically and can be scheduled to email department managers every Monday morning — giving them the data they need to lead their week without manual report generation.
Team vs Individual Productivity: Benchmark Your Departments
Staff productivity analysis at the team level answers a different question than individual monitoring. Individual data tells you whether a specific employee is performing. Team-level data tells you whether a department is resourced correctly, managed well, and working on the right things. Trackpilots provides both views from the same dataset.
Department-Level Average Score
Each team in Trackpilots has an aggregate productivity score calculated as the daily average of all member scores, weighted by hours logged. This means a senior engineer who worked 8 hours counts more towards the team score than a junior who worked 4 hours. Department averages let HR and senior management compare how engineering performs against QA, or how the Bangalore team compares to the remote US contractors — using the same objective methodology across all groups.
Identifying Top Performers and Underperformers
The Associate Rank view in Trackpilots lists all employees in a team ordered by their 30-day average productivity score. This gives team leads an objective ranking to use in quarterly reviews, promotion decisions, and performance improvement plans — replacing subjective impressions with a data-backed record. Top performers become visible even if they are quiet or remote; underperformers can be identified early enough for coaching rather than termination.
Workforce Productivity Analytics for Capacity Planning
When a department's average score drops, it could mean disengagement — or it could mean the team is overloaded with meetings, context-switching, or administrative work that Trackpilots correctly classifies as unproductive. The drill-down from team score to individual application breakdown reveals which of these is happening. This makes workforce productivity analytics a genuine capacity planning tool: before hiring more engineers, look at whether the existing team's productive hours are being consumed by preventable overhead.
All of this — individual scores, team benchmarks, trend lines, and department comparisons — is available in Trackpilots at no cost on the free plan for unlimited users. See what's included in each plan →
Multi-Platform Compatibility
Seamlessly track and monitor across Windows, Linux, and Mac for complete flexibility.
Still Need Help?
Drop us a line at team@trackpilots.com or hit us up in the chat at the bottom right corner, and we'll help you out.