DASHBOARD
Performance Analytics – Optimizing Employee Work Patterns

Tracking and analyzing employee work patterns help organizations enhance productivity. With detailed performance analytics, businesses can assess individual and team efficiency, making data-backed improvements.
Introduction
In today’s fast-paced work environment, tracking and analyzing employee productivity is essential for businesses to ensure efficiency. TrackPilots.ai offers a comprehensive analysis of work patterns, helping organizations understand employee engagement, application usage, and time efficiency.
With features such as App Usage Analytics, Weekly Summaries, and Work Time Efficiency Charts, managers gain deep insights into team productivity, enabling better decision-making.
Here’s a detailed breakdown of how these features work and what they reveal about workplace efficiency.
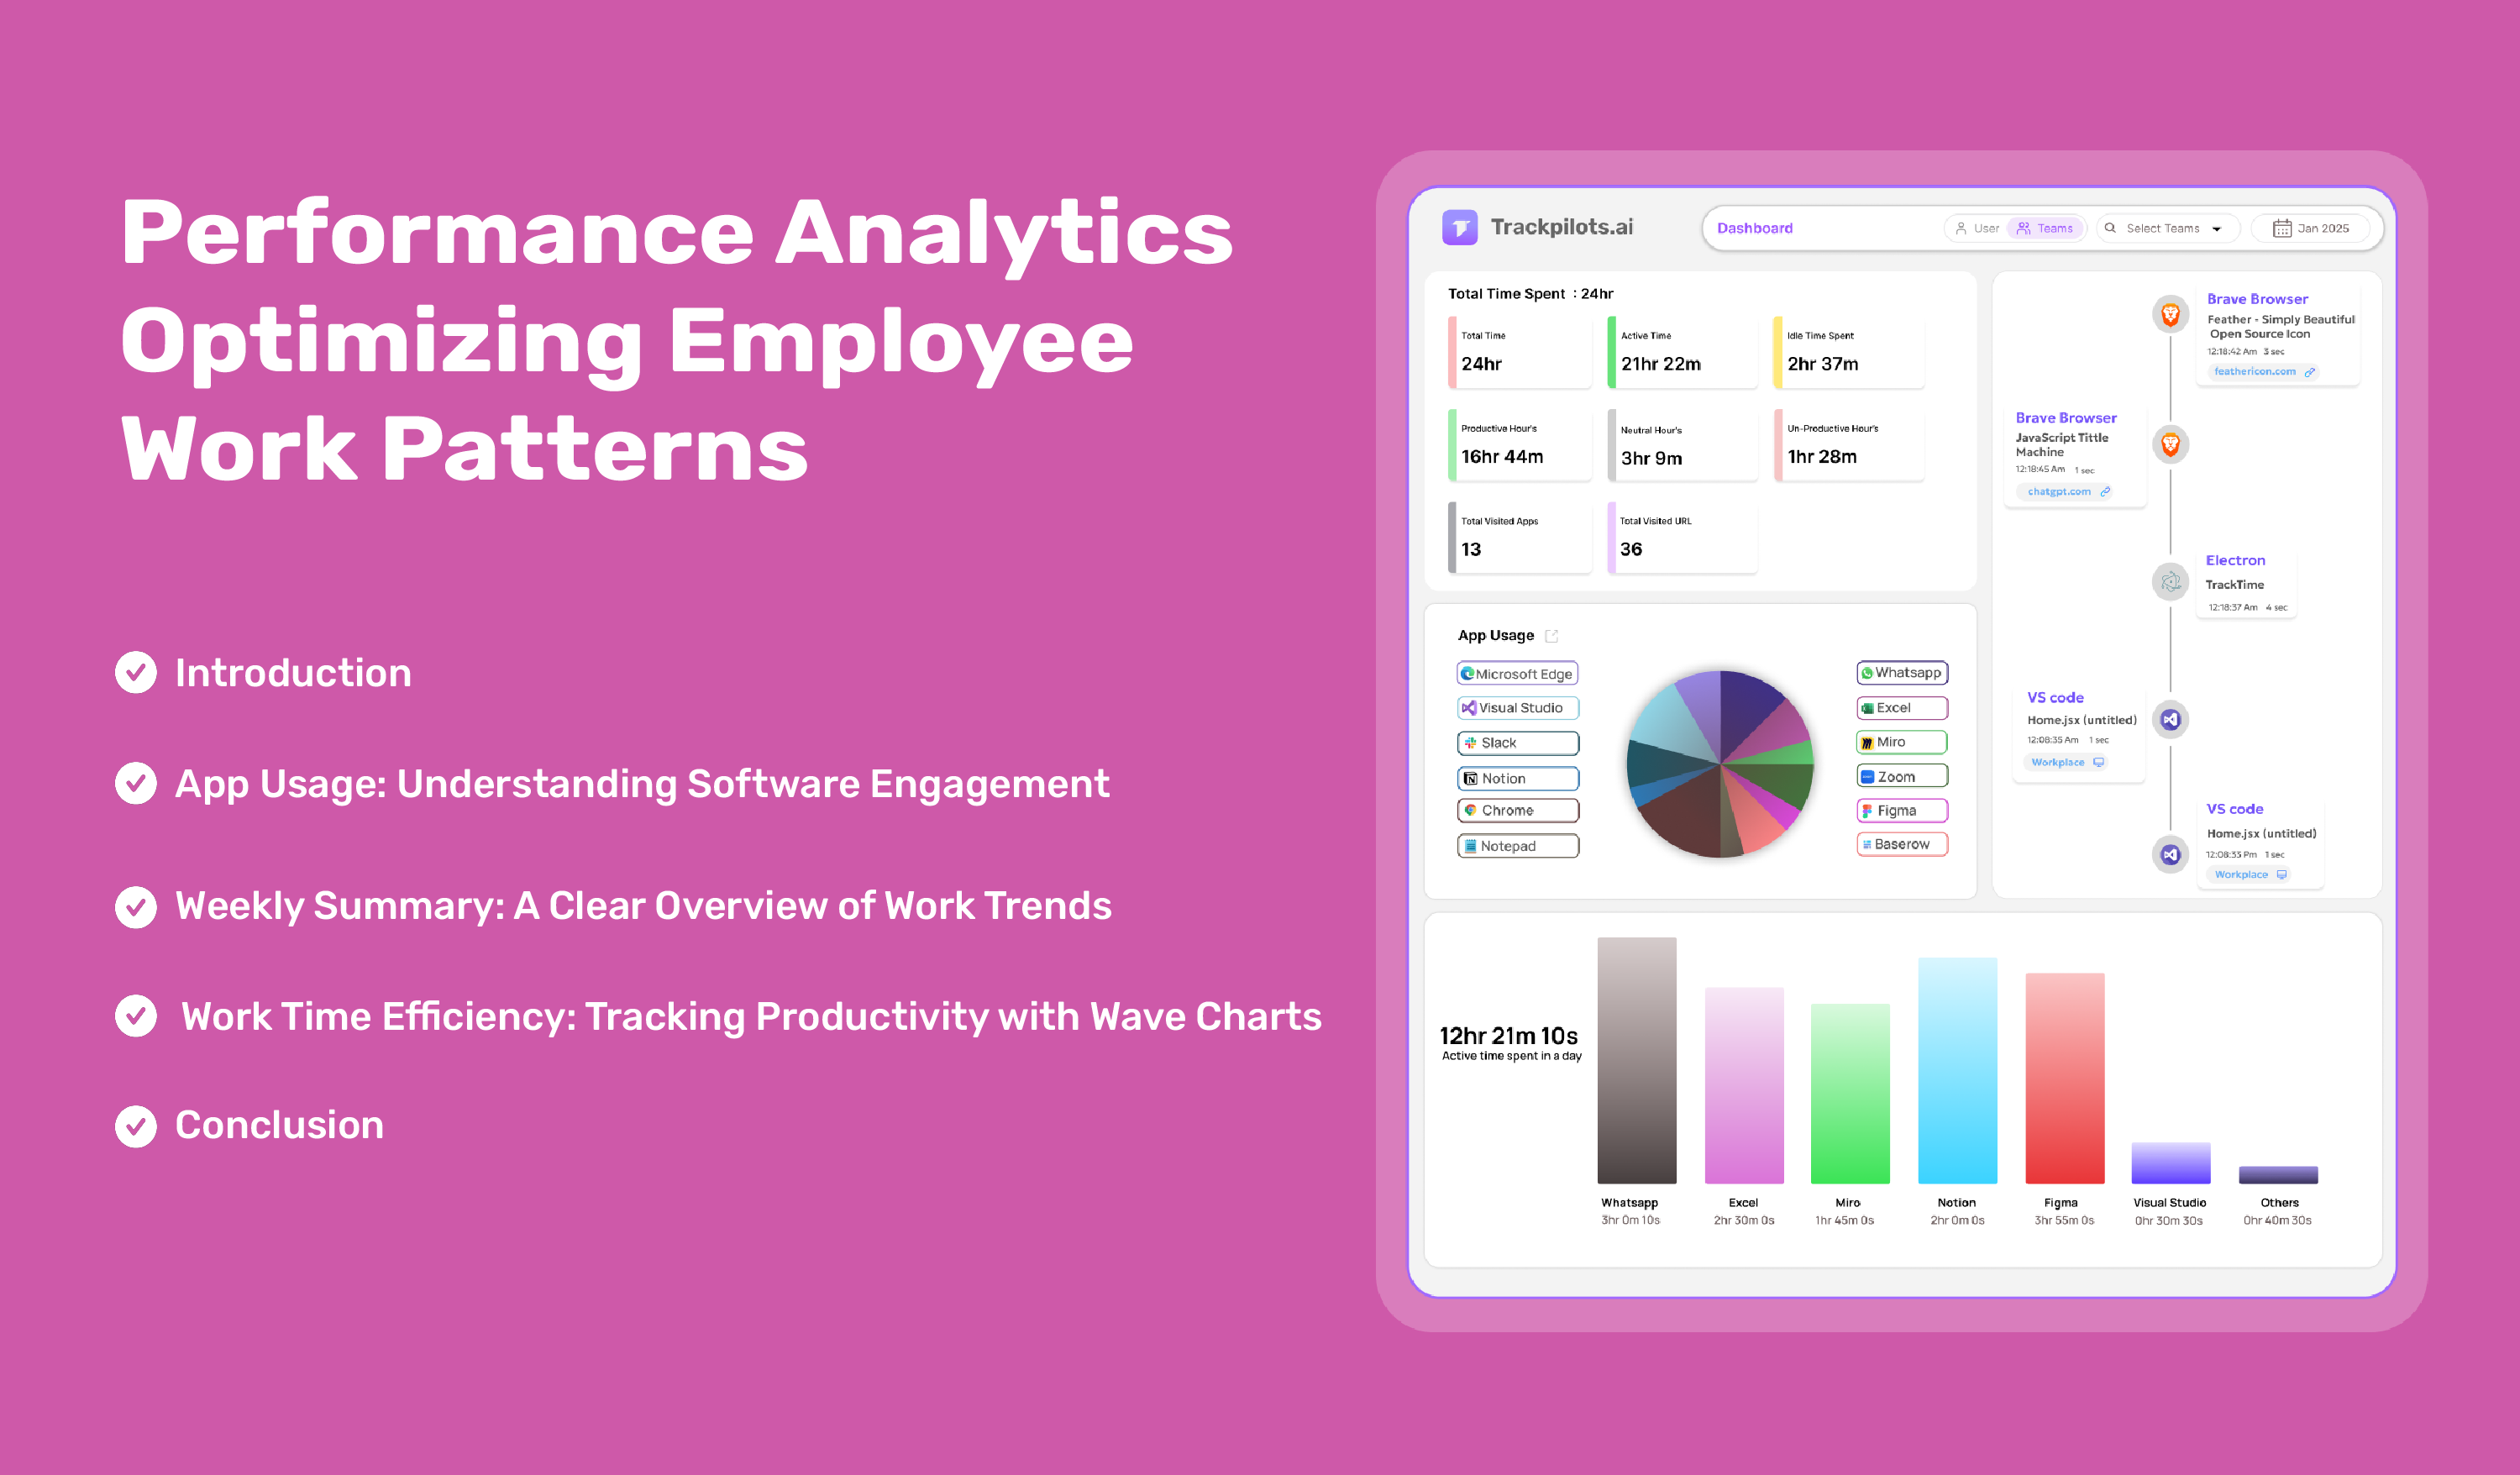
1. App Usage: Understanding Software Engagement
The App Usage feature provides a circle analysis (circular chart) that visually represents the different applications used by employees. This chart helps managers understand where most of the work hours are spent, categorizing applications based on their usage.
Some of the commonly monitored applications include:
Google Chrome – Web browsing activity for research, communication, and online tools.
Brave Browser – A privacy-focused browser that employees may use for specific tasks.
Visual Studio Code – A code editor primarily used by developers and programmers.
Windows Explorer – File management activities, including accessing work-related documents.
WhatsApp.exe – Messaging application, often used for internal communication.
Microsoft Office Applications – Tools like Excel, Picture Manager, and other office-related software.
Photos.exe – Image or media-related tasks.
SearchHost.exe – Windows background service for searching files and data.
How This Helps Businesses
Identifies which applications are used the most, allowing managers to ensure employees are using the right tools for work.
Helps in detecting potential distractions by tracking non-work-related app usage.
This feature provides a transparent view of employee engagement, ensuring that time is spent productively on work-related applications.
2. Weekly Summary: A Clear Overview of Work Trends
The Weekly Summary feature presents work data using a pie chart visualization, giving a quick overview of employee performance over a defined period. This helps businesses track overall work hours and employee contributions throughout the week.
Key Data Points Covered
Total Work Hours: Displays the accumulated work hours for the selected period.
Daily Performance Trends: Highlights work patterns across different days of the week.
Employee Work Distribution: Shows the proportion of work contributed by individual employees.
Why This Matters
Allows managers to identify peak productivity days and optimize workload distribution.
Helps in recognizing underperforming days, enabling businesses to address potential causes such as burnout or inefficient scheduling.
Ensures fair workload allocation, preventing overburdening of specific employees.
With this feature, managers can strategically plan and enhance workforce efficiency based on data-driven insights.
3. Work Time Efficiency: Tracking Productivity with Wave Charts
The Work Time Efficiency feature utilizes a wave chart to depict fluctuations in productivity levels over time. This graphical representation of efficiency trends helps businesses assess work engagement dynamically.
Key Metrics Analyzed
Active Work Time: The amount of time employees are actively engaged in work-related tasks.
Idle Time: Periods of inactivity, helping to pinpoint potential inefficiencies.
Productivity Spikes and Drops: Highlights when employees are most productive and when engagement decreases.
Benefits of Work Time Efficiency Tracking
Helps in identifying productivity patterns, allowing managers to implement strategies that enhance engagement.
In time management improvements by recognizing areas where employees may need better scheduling.
Enables businesses to adjust workflows, ensuring a balanced approach to work distribution.
By analyzing these efficiency patterns, businesses can optimize employee schedules, improve work-life balance, and ensure high levels of productivity.
Conclusion
A well-structured productivity dashboard enables organizations to move from guesswork to data-backed decision-making, fostering a culture of efficiency and accountability. TrackPilots.ai provides a data-driven approach to monitoring workforce activity, helping businesses make informed decisions about employee engagement and efficiency. By leveraging features such as App Usage Analytics, Weekly Summaries, and Work Time Efficiency Charts, managers gain:
A clear understanding of software usage, ensuring employees use the right tools for work.
Insight into weekly work patterns, allowing for better workload management.
A dynamic analysis of productivity trends, helping optimize work schedules and reduce inefficiencies.
With TrackPilots organizations can enhance workplace transparency, improve operational efficiency, and foster a more productive workforce.
Want to see how this works in Trackpilots?
See employee productivity analytics →