DASHBOARD
Workforce Engagement - Productivity Dashboard

Tracking and analyzing employee work patterns help organizations enhance productivity. With detailed performance analytics, businesses can assess individual and team efficiency, making data-backed improvements.
Introduction
In today’s fast-paced work environment, data is key to making informed decisions. A productivity dashboard provides real-time insights into employee activity, helping organizations optimize performance.
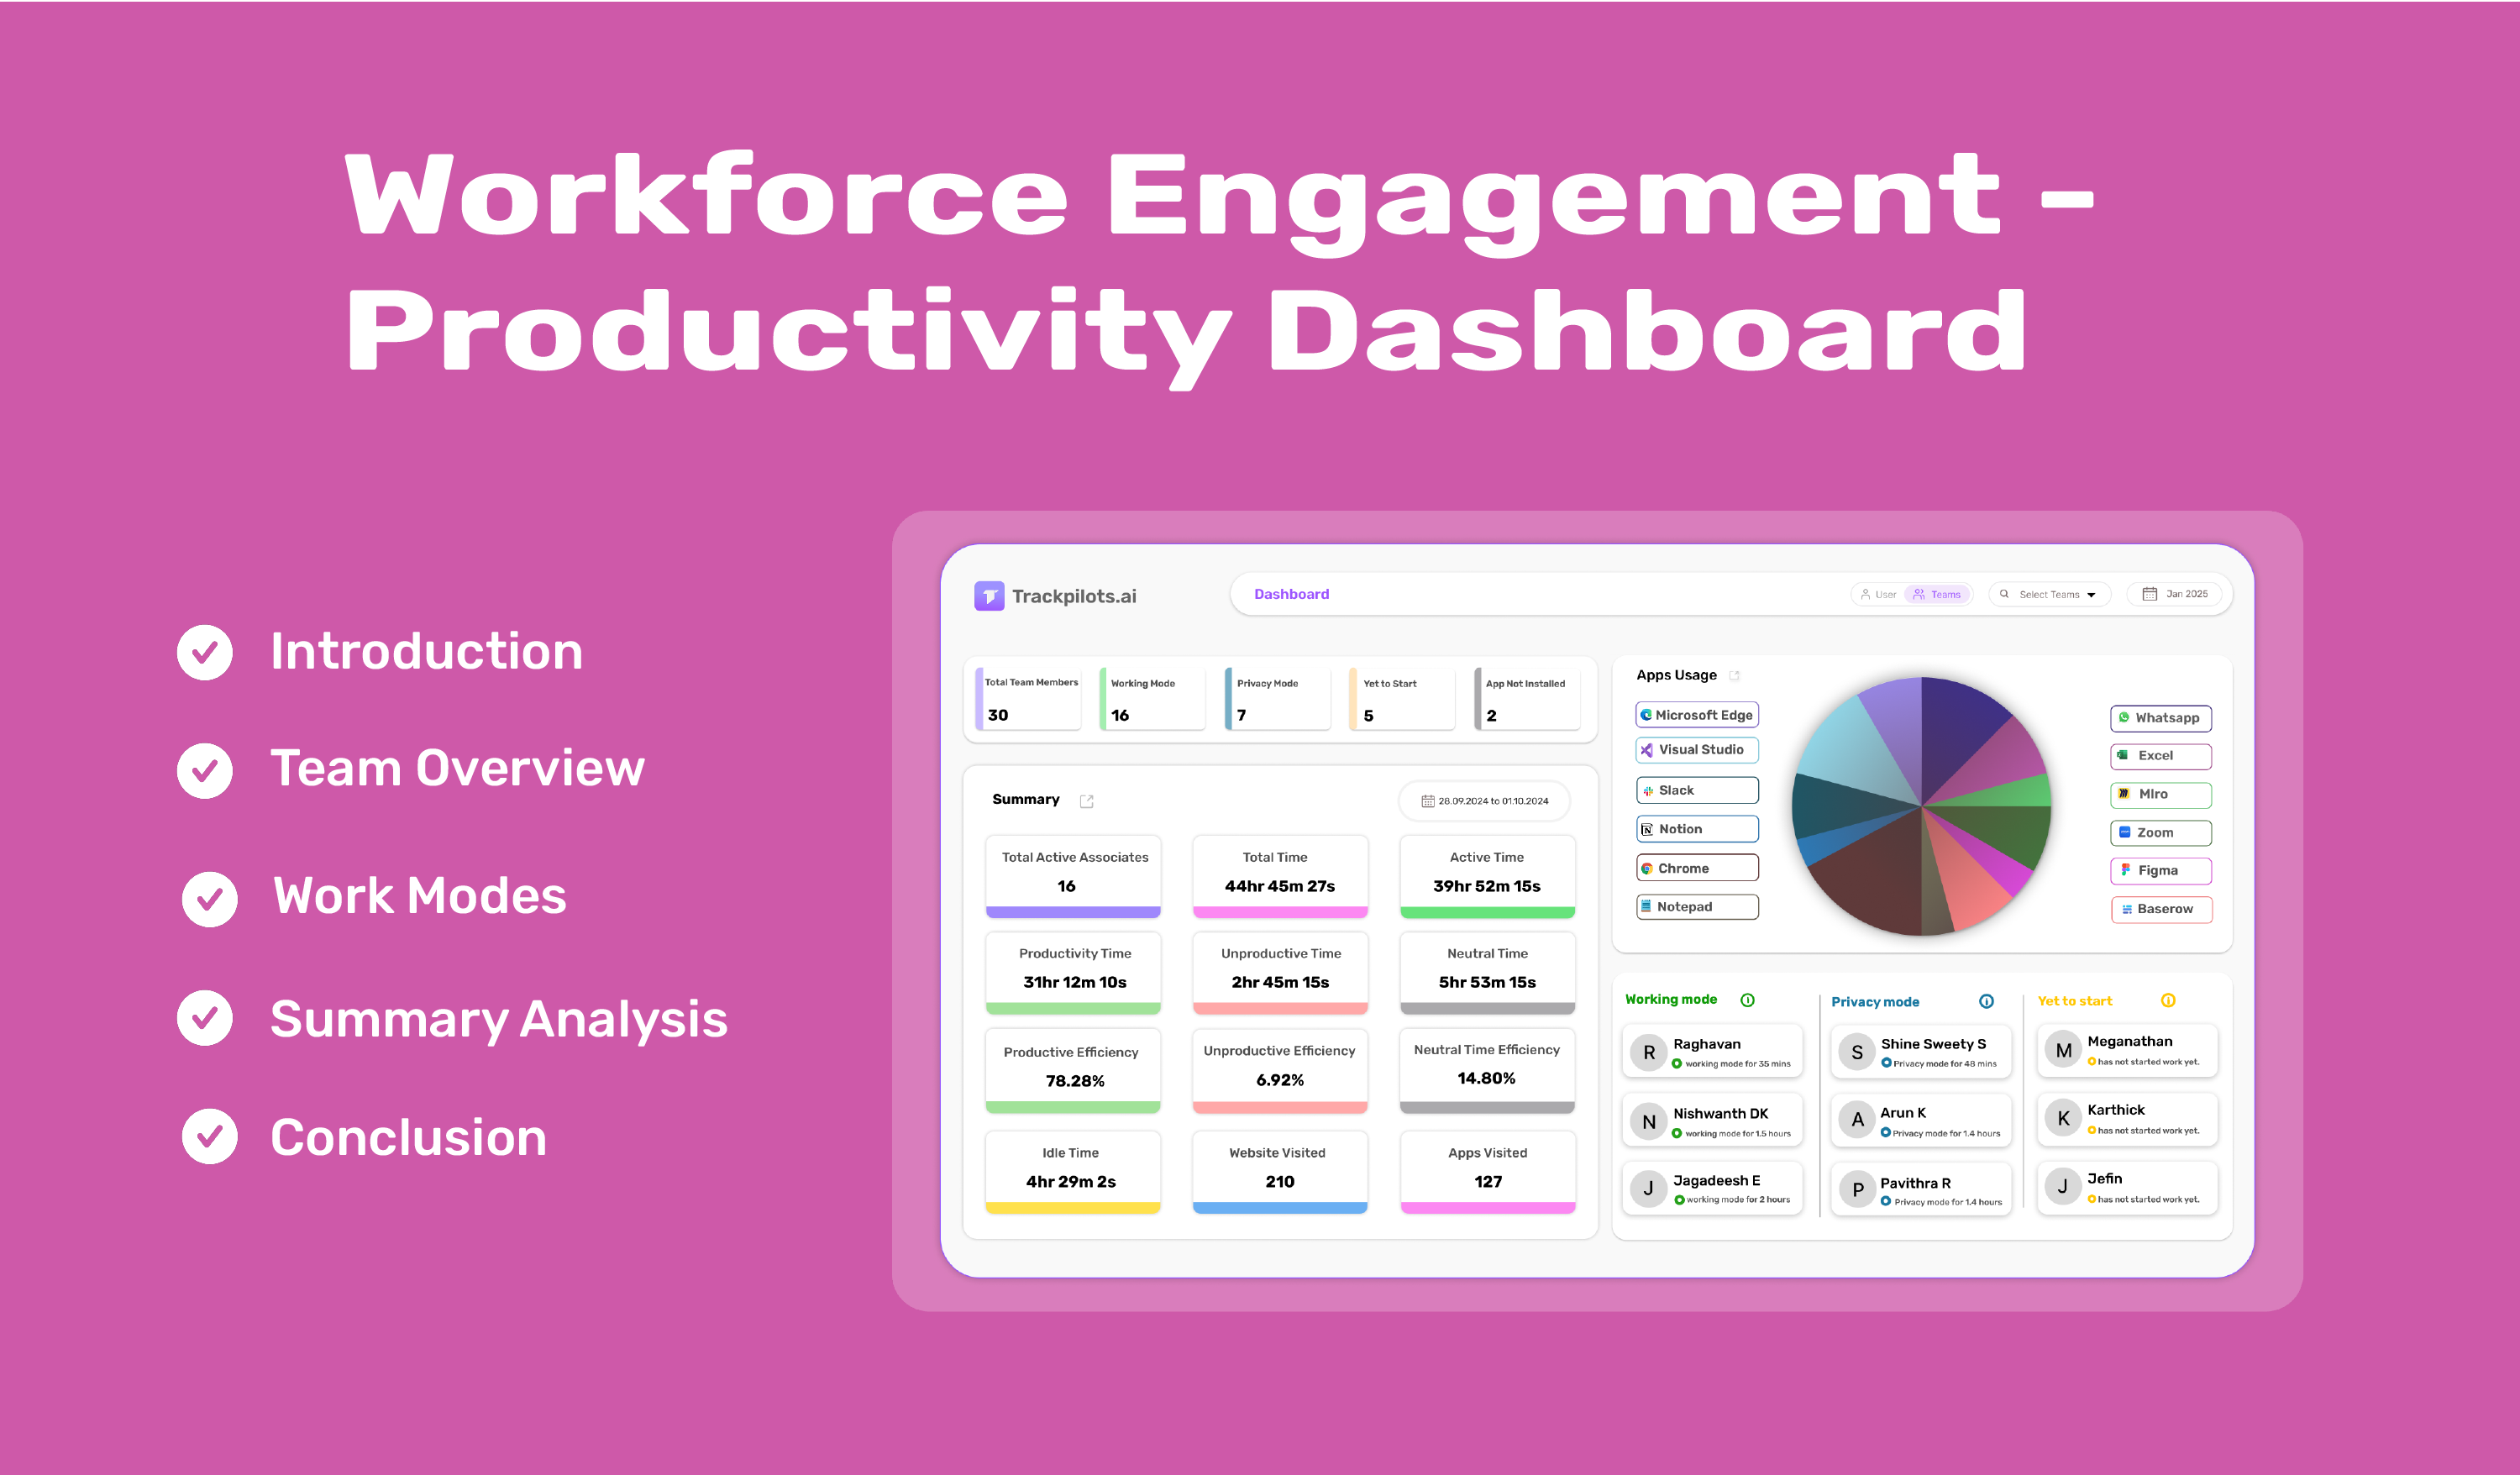
TrackPilots.ai provides a comprehensive dashboard that offers real-time tracking of employee activities, helping businesses gain deeper insights into work patterns. The dashboard is divided into three main sections:
Team Overview – A snapshot of the workforce and their status.
Work Modes – Categorization of employees based on their activity.
Summary Analysis – A detailed report on productivity, efficiency, and engagement.
This article explores each of these sections in detail, explaining how they contribute to a data-driven approach for optimizing workforce management.
1. Team Overview: A Quick Snapshot of the Workforce
The Team Overview section provides an instant summary of the current workforce and their activity levels. It displays the following key data points:
Total Team Members: 20 – The total number of employees being monitored.
Working Mode: 1 – Employees who are currently active and working.
Privacy Mode: 0 – Employees who have enabled privacy mode, preventing tracking.
Yet to Start: 13 – Employees who have not started working yet.
App Not Installed: 6 – Employees who have not installed the required application for tracking.
The TrackPilots Dashboard provides a quick overview of the team’s status. Out of 20 total employees, only 1 is actively working, while 13 have yet to start. No employees are in Privacy Mode (0), and some have not installed the required app for tracking. This section allows managers to quickly assess team engagement, identifying who is active, who hasn’t started, and who may need follow-up reminders.
2. Work Modes: Tracking Employee Activity Levels
This section categorizes employees based on their current status. By organizing team members into different modes, managers can easily see who is working and who is yet to begin their tasks.
The dashboard separates employees into:
Working Mode: Employees who are currently active and working.
Privacy Mode: Employees who have enabled privacy mode and are not being tracked.
Yet to Start: Employees who have not yet begun their work.
This classification is useful for ensuring that employees are staying on track and that there is transparency in workforce activity.
3. Summary Analysis: Understanding Team Productivity
The Summary Analysis section provides an in-depth look at how employees are performing during their work hours. It focuses on several important productivity metrics.
Team Performance Metrics
Total Active Associates: The number of employees actively engaged in work.
Total Time: The total time employees have spent logged in and working.
Active Time: The duration for which employees have been actively engaged in tasks.
Productivity Time: The total time classified as productive work.
Unproductive Time: The total time spent on unproductive activities.
Neutral Time: Time spent on activities that are neither marked as productive nor unproductive.
In this case, all recorded time falls under neutral activities, meaning no specific productivity tracking has been applied yet.
Efficiency Metrics
Productive Efficiency: Since there is no recorded productive time, efficiency cannot be calculated.
Unproductive Efficiency: There is no unproductive time recorded, so this metric remains unavailable.
Neutral Time Efficiency: Efficiency for neutral time is not calculated.
Idle Time: No time was spent in an idle state.
These efficiency metrics help businesses measure employee engagement and optimize workflows. Once productivity tracking is fully in use, these metrics will provide more valuable insights.
Website and App Tracking
Websites Visited: The number of websites accessed by employees.
Apps Visited: The number of applications used during work hours.
This information helps managers analyze employee behavior and ensure that work-related tools are being used effectively.
4. Associate Ranking: Measuring Individual Productivity
TrackPilots includes an employee ranking system that evaluates individual performance based on productivity. Employees are ranked according to their efficiency levels, making it easier for managers to identify top performers and those who need support.
Our Dashboard ranks employees based on their productivity.
For Example: Sakthivel Govinthan leads with 80.05% productivity, followed by Meganathan Sathyaraj (MS) at 19.95% productivity. This ranking helps managers identify top performers and support employees in improving their efficiency.
This ranking allows businesses to reward high-performing employees and provide coaching for those with lower productivity scores.
Conclusion
The TrackPilots Dashboard offers a structured and transparent way to monitor employee productivity, analyze work patterns, and optimize performance. With clear sections for team status, work modes, and performance tracking, businesses can make informed decisions and improve operational efficiency. By ranking employees and providing productivity insights, TrackPilots.ai helps organizations create a more engaged and productive workforce. By using real-time analytics and a data-driven approach, businesses can enhance workforce efficiency while ensuring fair and transparent monitoring of employee activities.